Wire Models, Wired
A brief history of UCSF Chimera
Published October 29, 2014
The molecular graphics software called Chimera, written and supported by a team of scientists in Tom Ferrin’s lab at the University of California, San Francisco (UCSF), has been cited over 7000 times and helps biologists and drug developers visualize molecules and biological structures in 3D at various resolutions. The tool has a personal history that traces back to 1994, and an ancestral history that stretches nearly four full decades earlier, to a London lab in 1955 and a man named Robert Langridge, also known as the pioneer of molecular graphics.
Though computation has changed almost indescribably since the middle of the 20th century, Ferrin faces some of the same challenges Langridge faced, such as how to work with data sets that far exceed the memory capacity of his computational tools. For Ferrin, Director of the UCSF Resource for Biocomputing, Visualization, and Informatics (RBVI), this problem has most recently presented itself in a collaboration with 2014 Nobel prize winner Eric Betzig, who with others developed super-resolution light microscopy, a technique that produces terabytes of data and presents Ferrin with the task of visualizing that data. “It’s an exciting problem to have,” says Ferrin. “Technology is always marching onward.”
The Beginning: Molecular Virtual Reality
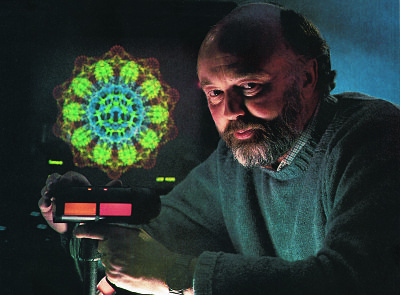
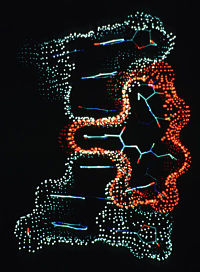
It was 1955 when Robert Langridge published his first important paper, in Nature, detailing the molecular structure of DNA based on X-ray diffraction data. Langridge was working with Maurice Wilkins, who along with James Watson and Francis Crick was awarded the Nobel Prize for their discoveries concerning the molecular structure of nucleic acids in 1962. Back then, there were two approaches to visualizing molecular structures. Scientists built wire models of them or sketched them. “The picture of DNA that’s in that article, I drew with a pen,” says Langridge, who is now retired and living in Berkeley CA, a professor emeritus at UCSF.
Doing the calculations that defined the structure was even more cumbersome. Langridge used a Marchant Calculator, a 1911 invention that looks like a cross between a typewriter and a cash register. It took two weeks to calculate a Fourier transform. “At the end of that two weeks, after modifying the model, you had to do it all again,” says Langridge.
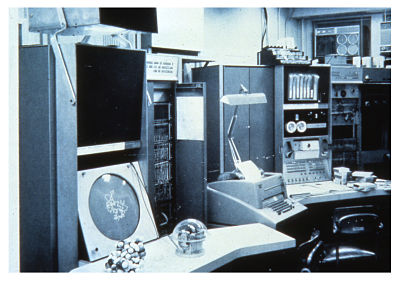
Around this time, Langridge got access to an IBM 650 computer, released in 1953, (a bi-quinary system) and learned to program it. Despite the fact that computers were so new that Fortran hadn’t even emerged as a language yet (the first FORTRAN compiler came out in 1957), and that he had only 2000 words of memory to work with, he loved programming and reduced the computation time of his calculations from two weeks to thirty minutes.
In 1964, Langridge, who had moved to Harvard University, received a phone call from his friend Cy Levinthal at MIT. Levinthal had come across a new computer system developed at MIT’s Project MAC, a defense-department funded effort to improve computation and, in particular, time sharing and computer graphics. The system had an advanced display that could show pictures in three dimensions. The displays were still rudimentary cathode ray tube consoles limited to simple line drawings, but the system also had a “crystal ball,” a bit like a track ball, that could be used to rotate an image on the screen.
Langridge crossed the river into Cambridge immediately and spent many nights programming the computer to display molecules and spin them in virtual space.
Langridge and Levinthal had created what was among the earliest virtual reality experiences. Prior to their graphics, the wire models that scientists built by hand were room-sized. The model of hemoglobin dwarfed the men that built it. The models were impossible to turn, they were brittle, they were frustratingly inaccurate, and you couldn’t get at their insides once they were constructed. “Also,” says Langridge, “pieces fell off.”
Yet when Langridge and Levinthal showed their molecular graphics to other scientists, their reaction was, essentially, Meh. “They asked, ‘Why do we need this? We have our wire models,’” says Langridge.
The Middle: Software Advances
The real barrier wasn’t the utility of the new tool; it was the practicality. The computer Langridge was working on was a two million dollar system that very few institutions had access to. But one group did see the utility. The National Institutes of Health Division of Research Resources, which supported technology development, granted Langridge funding to advance molecular graphics. In 1969, with this funding, he launched his Computer Graphics Laboratory at Princeton University.
In the meantime, computation was advancing on its own. Moore’s Law, the doubling of the number of transistors within an integrated circuit every two years, had already established itself as a trend in 1965, and costs were falling similarly. Still, computer graphics hardware was rare and expensive and would remain so for another two decades. “There were different flavors from one machine to another,” recalls Langridge. “It was very hard to share.”
In 1976, Langridge moved the lab to UCSF, where he met and hired Ferrin. They adopted UNIX, giving the tools some portability, though every computer system still had it’s own display language. Over the coming two decades, Ferrin and Langridge would design and redesign a series of molecular graphics systems, each one advancing with computing platforms, operating systems, and graphics capabilities. The first, called MIDS, was designed to support color graphics capabilities. In 1980, they developed the next-generation system called MIDAS, a complete rewrite, with an attempt to create a portable graphics language with documented source code to allow others to see under the hood.
The next incarnation, MidasPlus, was the first package written with an open architecture designed to allow others to contribute functions and extensions to the system. However, since code sharing and portability were still challenging and graphics hardware still costly, many research teams came to visit Langridge’s lab to use his systems.
Other teams were also at work developing molecular graphics. In particular, Alwyn Jones at Uppsala University in Sweden took on the task of answering the needs of crystallographers for electron density fitting tools. Langridge’s team was more focused on drug design. One of the most striking examples of how graphics aids drug developers searching for small molecule drugs is the discovery of buckminsterfullerene as an HIV drug. Based on the graphical display of HIV protease, a graduate student made an off-handed remark that “anything might fit into the protease, even buckminsterfullerene,” says Langridge. “It did.”
The Future: Technology Marches Onward
In the mid-1990s, Langridge retired and Ferrin took over as Principal Investigator. The lab took on its current name, replacing the original “Computer Graphics Laboratory” moniker. “Times changed,” says Ferrin.
Indeed, computer graphics was in the midst of a transformation. During the 1980s, the team had taken advantage of SGI (Silicon Graphics, Inc.) workstations with onboard graphics hardware. But in the 1990s, demand from the computer gaming community drove the rapid development of very large scale integration (VLSI) graphics. Graphics hardware was no longer rare and expensive. “Now graphics chips come for free on virtually every laptop and desktop on the market,” says Ferrin.
To keep up with these changes, Ferrin decided to replace MidasPlus and create Chimera in 1994. Today the tool is used to visualize molecular models made using crystallography, electron microscopy, NMR, and also theoretical models made using hybrid methods that combine experimental data and theoretical computational methods.
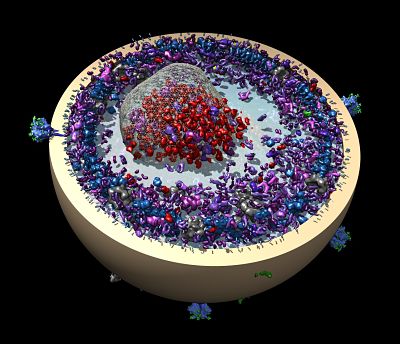
Work is also underway to support super-resolution light microscopy in a collaboration between Ferrin, Betzig of the Howard Hughes Medical Institute’s Janelia Farm Research Campus, and Dyche Mullins of UCSF. The project began when a post-doc in the Mullins lab, Lillian Fritz-Laylin, collected a time-series of images of macrophage-like immune cells in motion using Betzig’s new microscope. The microscope captures 3D images about once per second at resolutions of about 200 to 250 nanometers, not atomic resolution, but still at a dynamic level never before seen. The data — 40 terabytes in all — came home with Fritz-Laylin, but was left untouched for months because she had no tools to use to visualize it.
For the past year or so, Ferrin’s lab has been working to enhance Chimera to read, process and visualize the data. Simply reading a terabyte off a disk takes three hours and, since no computer has a TB of real memory, he also faced the same limitations Langridge faced back when bytes came at a premium. While the new microscopy has challenged Ferrin, he and the other collaborators have also provided Betzig with feedback that has helped him improve his instrument. The collaborators hope to publish soon. “These are some of the first 3D images of cells in motion,” he says. “It’s just fantastic.”
-- Elizabeth Dougherty